
Dashboards are most useful when you have good information about the past saved. Please follow best practices and your dashboards will help everyone.
Actions with the dashboard
1. View the dashboard:
-
The report viewer in the view mode for dashboard panels differs from the report viewer in the report view mode.
-
The dashboard panel and its elements are stretched to the entire area of the viewer.
-
Combo Box, Date Picker, and Tree View Box can only be stretched in width.
-
The dashboard and its elements contain various control buttons.
Control buttons of the dashboard:
Dashboard controls are located in the upper right corner above the dashboard panel.
-
The Refresh button is used to update the dashboard.
-
The Open button is used to open a previously saved report file.
-
The Edit button is used to change the rendered dashboard in the report designer.
-
This can only be done if, before rendering the dashboard panel, the Calculation Mode property of the template is set to Interpretation.
-
-
The Full-Screen button: to view the dashboard in full-screen mode.
-
To exit this mode, you can use the Esc or Alt+F4 hotkeys.
-
-
The Save button will open a menu with various commands for controlling the dashboard panel.
Element controls
The control buttons of the dashboard elements are located in the upper right corner of the area of this element.
The Sort button: opens a menu to define the data column and the sorting direction for the values of the current element of the dashboard panel.
- It can enable or disable the filtering mode for several segments.
- You can select several segments on one dashboard element to filter data when enabled.
- When disabled, the previous filter will be reset when selecting the next segment.
-
-
- For example, when filtering by map, in the single mode, when you click on each segment, other elements of the dashboard panel will only display related data with the current map segment. In the filtering mode by several segments, other dashboard elements will display the associated data with all selected segments of the map.
-
- Used to switch to the lower level of the drill-down of an element. This is only displayed if the drill-down mode for the element is enabled.
- Used to go to the upper level of the drill-down of the element. This is only displayed if the drill-down mode for the element is enabled.
The Full Screen button: displays a specific dashboard element over the entire viewer area.
The View Data button: displays a window with the data used in the current element of the dashboard will be called.
When viewing the dashboard in the report viewer, you can convert its elements to PDF, Excel, and image files such as BMP, GIF, PNG, TIFF, JPEG, PCX, EMF, SVG, and SVGZ.
In addition, you can save the dashboard as a report snapshot.
- To export the dashboard, click the More Options button and select the appropriate command.
-
If you want to convert only a specific element, click the Save button on that element and select the file type.
- After selecting the export format, the export options dialog will be called.
- The parameters may vary depending on the type.
Report snapshot
- The Report Snapshot command saves the dashboard with the current data to the .mrt file.
-
The created data sources will be embedded into the report as resources.
You can open this report both in the report designer and report viewer.
PDF Export Settings
Export settings for the dashboard or its elements when converting to a PDF file.
- The Paper Size option allows you to select the page size in the PDF document.
- The Orientation parameter selects the page orientation in the PDF file - Portrait or Landscape.
- The Image Quality option is used to change the quality of images.
- The Open After Export parameter allows you to open the exported document after completing the export process.
Export settings for the dashboard or its elements when converting to an Excel file.
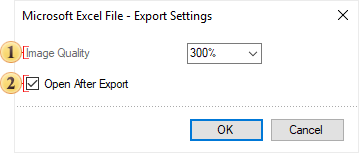
- The Image Quality option allows you to change the quality of images.
- The Open After Export parameter allows you to open the output document after completing the export process.
Export settings for the dashboard panel or its elements when converting to an image file.
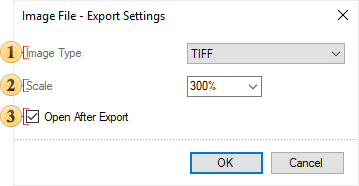
- The Image Type parameter determines the type of image into which the report will be converted - BMP, GIF, PNG, TIFF, JPEG, PCX, EMF, SVG, SVGZ.
- The Scale parameter is used to change the number of pixels per inch.
- The Open After Export parameter allows you to open the exported document after completing the export process.
Export settings for the Table element when converting it to a data file.
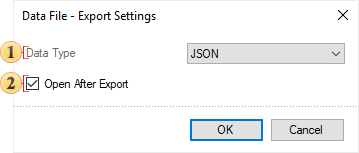
- The Data Type parameter is used to specify the type of data file into which the report will be converted - CSV, DBF, XML, JSON, DIF, SYLK.
- The Open After Export parameter allows you to access the exported document after completing the export process.
Creating dashboards
Use the report designer to add a new dashboard in the report:
Click the Dashboard button on the Insert tab

Select New Dashboard in the context menu of the page title or dashboard panel

The size of a dashboard
The dashboard has a working area that looks like a white sheet with a grid. Change the size of the dashboard in the report designer by:
Double-click on the working area of the dashboard;
Specify the dashboard's width and height in pixels.

Control commands can also create the same free distance from the top-bottom and left-right.
The elements can stretch (shrink) or keep their size unchanged to change the dashboard's working area size.
-
This depends on the Scale Content parameter.
-
With this option enabled, all elements will also be stretched or shrunk.
-
With this option disabled, only the size of the dashboard's working area will increase, while the size of the elements will remain unchanged.
The Content Alignment parameter defines the indicator panel mode in the view area.
Depending on the parameter value you select, a dashboard will be stretched in the view area, or remain unchanged.
For the Content Alignment parameter, you can set:
Left, Right, or Center—The dashboard will not be stretched in the viewer. This value defines only its horizontal alignment in the viewer area.
Stretch—The dashboard will be stretched horizontally across the entire viewer area. The height of the current dashboard can also be changed to keep its aspect ratio.
Stretch XY—The dashboard will be stretched (or shirked) horizontally and vertically across the entire viewer area.
All elements of the dashboard are grouped into the following categories according to their functionality:
Elements of data analysis
- Table
- Chart
- Pivot
- Indicator
- Progress
- Maps
Elements of data filtering
- List box
- Combo box
- Tree View
- Tree View Box
- Date Picker
Other dashboard elements
- Panel
- Text
- Image
- Shapes
- Button
- Drag items from the Toolbox or the Insert tab to the working area of the dashboard.
- Select items on the Toolbox or the Insert tab and left-click in the dashboard panel.
Changing the item type
You can change the type of the element without redesigning it.
-
Select an element that needs to be changed on the dashboard;
-
Left-click on the Change Type button;
-
In the open menu, select the element you want to convert to the current one.